
How Many Data Centers Are There in the World (and How Much “Power” + Storage Do They Add Up To)?
If you try to answer this with one clean number, you’ll immediately hit a problem:
There isn’t a single global registry of data centers.
What we do have are large commercial directories (Cloudscene, DataCenterMap, etc.) and market research firms that track capacity, power demand, and hyperscale buildouts.
So the most honest way to do this is:
give a range for “how many data centers exist,” based on major databases,
break them down by region/continent + country, using a consistent source for counts,
explain “combined computing power” and “combined storage” using industry proxies (electricity demand, grid capacity, zettabytes), because FLOPS/server totals are not reported globally.
1) So… how many data centers are there worldwide?
Two widely used directories disagree (because they track different sets of facilities):
DataCenterMap lists 10,444 data centers worldwide (as of their current database snapshot). (Data Center Map)
Cloudscene-based reporting commonly cites 11,800+ operational data centers globally. (Voronoi)
Practical takeaway:
A defensible 2025–2026 “internet-scale” answer is ~10,000 to ~12,000 listed/trackable data centers worldwide, depending on the directory and inclusion rules. (Data Center Map)
2) Data centers by continent / region (with country breakdowns)
For country-by-country counts, the cleanest public list right now is Cloudscene’s regional pages (they show explicit per-country counts). The only big gap: Cloudscene doesn’t present an Africa region page, so for Africa we’ll use DataCenterMap.
Also note: Cloudscene’s “South America” region is effectively Latin America (it includes Mexico, Central America, and Caribbean locations). I’m keeping Cloudscene’s groupings visible so the numbers remain consistent and verifiable.
North America (Cloudscene region)
Cloudscene’s “North America” region is heavily dominated by the U.S. and Canada:
United States: 5,427
Canada: 337
Cayman Islands: 3 (Cloudscene)
Europe (Cloudscene region)
Europe is more distributed than North America, but Germany + UK lead:
Top countries (selection):
Germany: 529
United Kingdom: 523
France: 322
Netherlands: 298
Russia: 251
Italy: 168
Poland: 144
Spain: 144
Switzerland: 121
Sweden: 95
…and a long tail across dozens of countries (Romania: 31, etc.). (Cloudscene)
Asia (derived from Cloudscene “Asia Pacific”)
Cloudscene labels this region “Asia Pacific,” and it includes Australia + New Zealand. If you want “Asia” in the geographic sense, you can still use the same list—just be aware Australia/NZ are included.
Largest markets in the Cloudscene APAC list:
China: 449
Japan: 222
India: 153
Hong Kong: 122
Singapore: 99
Indonesia: 88
Malaysia: 62
South Korea: 43
Thailand: 42
Philippines: 39
Vietnam: 33
Taiwan: 19
…plus smaller markets (Pakistan, Bangladesh, Cambodia, etc.). (Cloudscene)
South America (Cloudscene region = Latin America)
Cloudscene’s “South America” region includes Mexico and several Central America/Caribbean markets, so read this as Latin America:
Top countries:
Brazil: 197
Mexico: 173
Chile: 59
Colombia: 41
Argentina: 29
Peru: 21
Panama: 20
Puerto Rico: 19
…plus a long tail (Guatemala, Ecuador, Costa Rica, etc.). (Cloudscene)
Oceania (Cloudscene region)
Australia: 313
New Zealand: 83
Papua New Guinea: 4 (Cloudscene)
(You may notice Australia shows up as 314 on one APAC-related page—directory counts can shift as listings are added/removed. For Oceania, the regional page is the cleanest reference.) (Cloudscene)
Africa (DataCenterMap)
Because Cloudscene doesn’t provide a comparable “Africa region” page, here’s a directory-based view from DataCenterMap:
Total listed in Africa: 241 across 40 countries
Top markets include:South Africa: 57
Nigeria: 22
Kenya: 20
Morocco: 14
Tanzania: 11
Angola: 10
Mauritius: 10 (Data Center Map)
3) What is their combined computing power?
If you mean “how many FLOPS do all the world’s data centers produce,” there is no global public number—because:
data centers don’t disclose server inventories in a standardized way,
compute is heterogeneous (CPU, GPU, TPU, custom ASICs),
utilization changes daily (idle vs training spikes).
So the industry uses proxies that correlate strongly with compute scale:
Proxy A: global electricity consumption (IEA)
The International Energy Agency estimates:
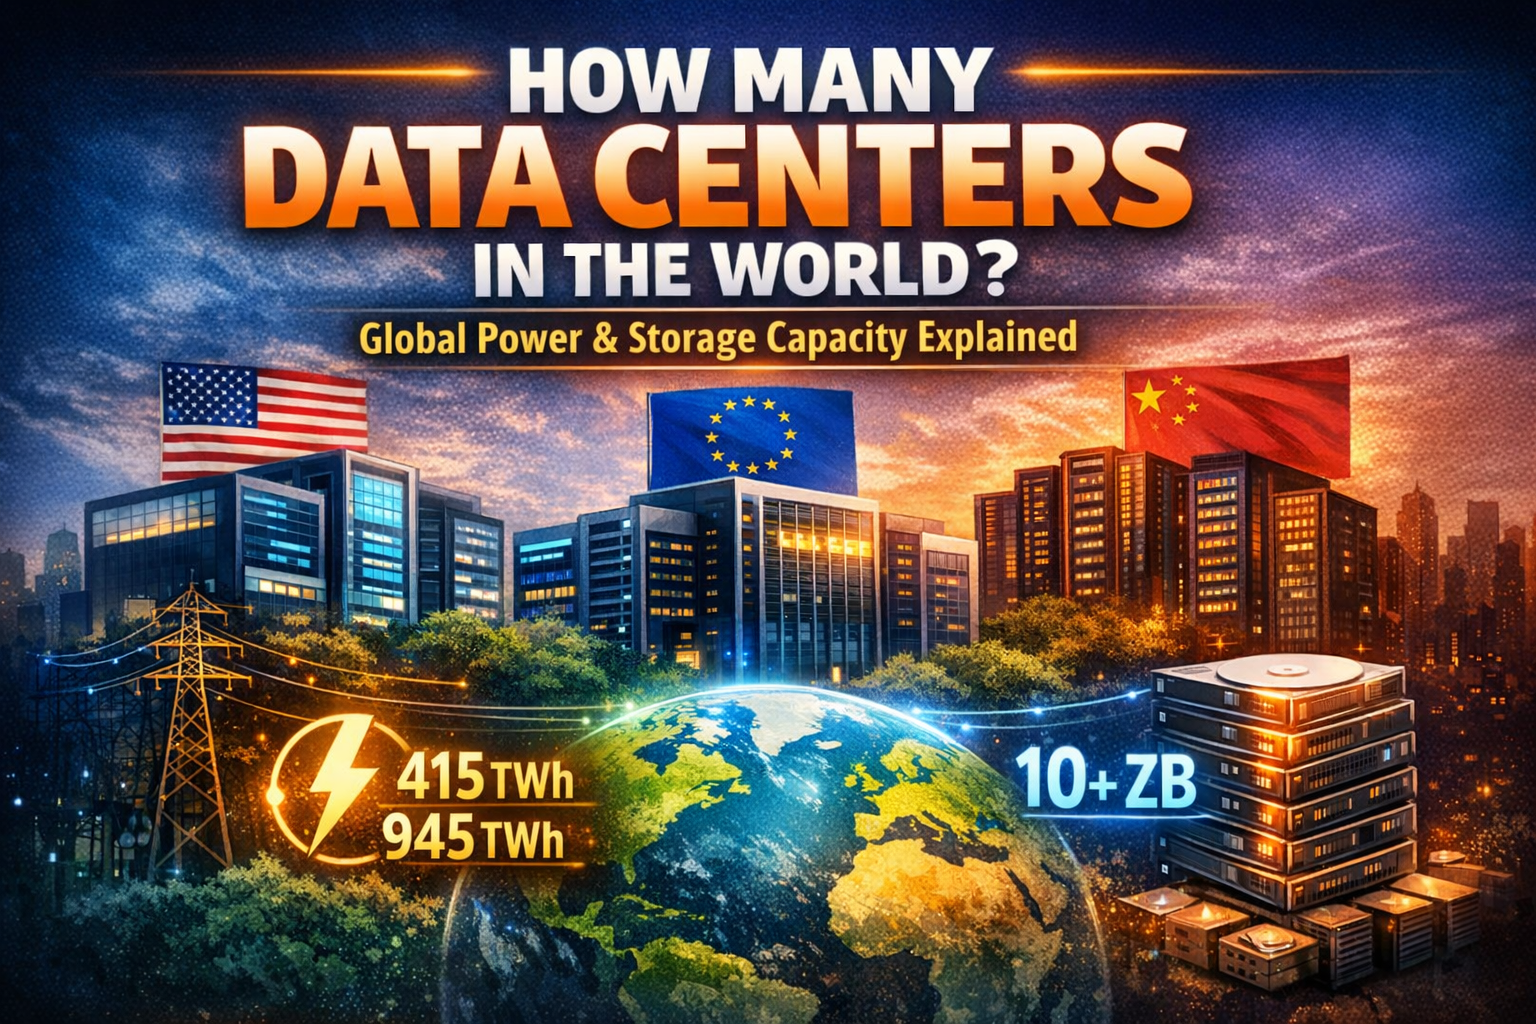
Data centers used ~415 TWh in 2024, about 1.5% of global electricity consumption. (IEA)
In the IEA base case, data center electricity consumption roughly doubles to ~945 TWh by 2030. (IEA)
A helpful conversion:
415 TWh/year ≈ 47.4 GW average continuous power draw (415 ÷ 8,760).
945 TWh/year ≈ 108 GW average continuous draw.
That doesn’t equal “IT load” exactly (cooling + overhead matter), but it’s the best global indicator of “how much compute is happening.”
Proxy B: grid power committed to big data center categories (451 Research / S&P Global)
451 Research (S&P Global) forecasts utility power provided to hyperscale, leased, and crypto-mining data centers rising to ~61.8 GW by end of 2025. (S&P Global)
Important: that figure excludes many enterprise-owned facilities, so it’s not “all data centers,” but it shows how huge the hyperscale/leased segment has become. (S&P Global)
Proxy C: hyperscale site counts (Synergy Research)
Synergy Research reports:
1,136 hyperscale data centers at end of 2024, up from 992 at end of 2023. (srgresearch.com)
Hyperscale sites are not “most data centers by count,” but they represent a massive share of compute growth—especially for AI training/inference.
4) What is their combined storage space?
Same issue as compute: there’s no single public “total installed disk/SSD in all data centers” registry.
So we use macro estimates expressed in zettabytes (ZB):
A) Data-center storage capacity growth (JLL)
JLL cites data center storage capacity growing from about 10.1 ZB (2023) to 21.0 ZB (2027). (IDC)
B) Installed base of stored capacity (IDC via Wasabi)
Wasabi references IDC’s StorageSphere-style estimates of the installed base of stored capacity growing from 6.7 ZB (2023) to 15.8 ZB (2028). (Wasabi)
These two are not identical metrics (different scoping/definitions), but they’re directionally consistent:
storage growth is measured in multiple zettabytes,
and it’s rising fast as AI + media + logs + backups expand.
Practical takeaway:
Even conservative readings imply the “combined storage space” inside the world’s data-center ecosystem is now comfortably in the multi-zettabyte range, and it is likely to roughly double over a few years under mainstream forecasts. (IDC)
5) Why regional counts don’t line up perfectly (and why that’s normal)
When you see “10,444” vs “11,800+”, or Australia listed as 313 vs 314, it’s usually one of these:
different inclusion rules (enterprise sites? telecom huts? edge sites? “announced” vs “operational”),
different update cycles,
different definitions of “data center” (full facility vs a campus counted as one vs many buildings counted separately).
That’s why the best way to write about this is:
use one directory for counts,
use IEA / research firms for power + capacity trends,
and be explicit about definitions.
6) What this means for 2026 (and why it matters to web/software)
If you’re building SaaS or web products, the headline story isn’t just “more data centers.”
It’s:
Power is the new bottleneck. The IEA numbers make it clear electricity demand is climbing fast. (IEA)
AI changes capacity planning. Training clusters (GPU-heavy) and inference footprints reshape where new builds happen.
Latency + sovereignty keep regional growth strong. That’s why we keep seeing large investments and new regions announced globally.